WorkMindCompass
MindCompass
Mental-health testing tools tended to be either too complex to finish or too slight to trust. Onboarding drop-off was high on one side, and clinicians were reading raw results without a dashboard on the other.
- Timeframe
- 2024
- Role
- UX research & interface design
- Scope
- UX Research, Product Design, Interaction Design
One test, four different readers.
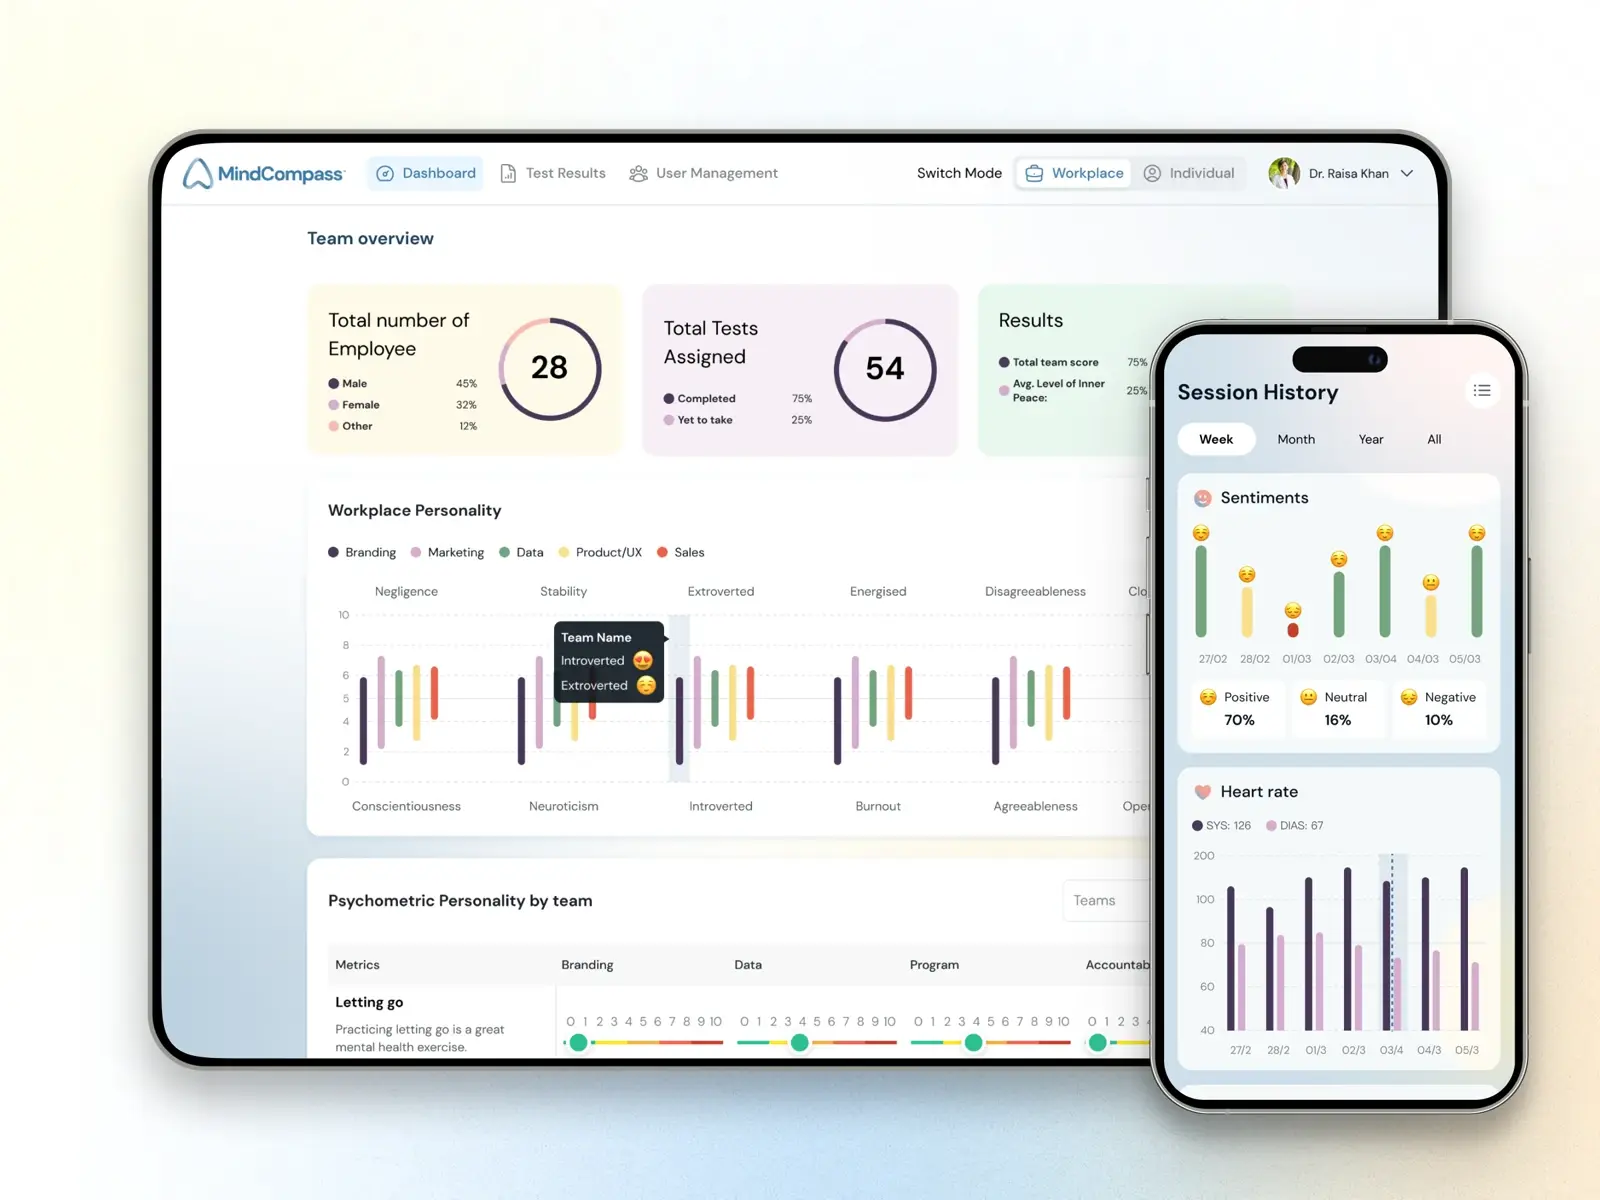
A clinician, an HR lead, a chief executive and the person who took the test all need the same results framed differently. The product is really four dashboards over one dataset, and most of the design work was deciding what each of them is not allowed to see.
Scores that stay attached to their meaning.
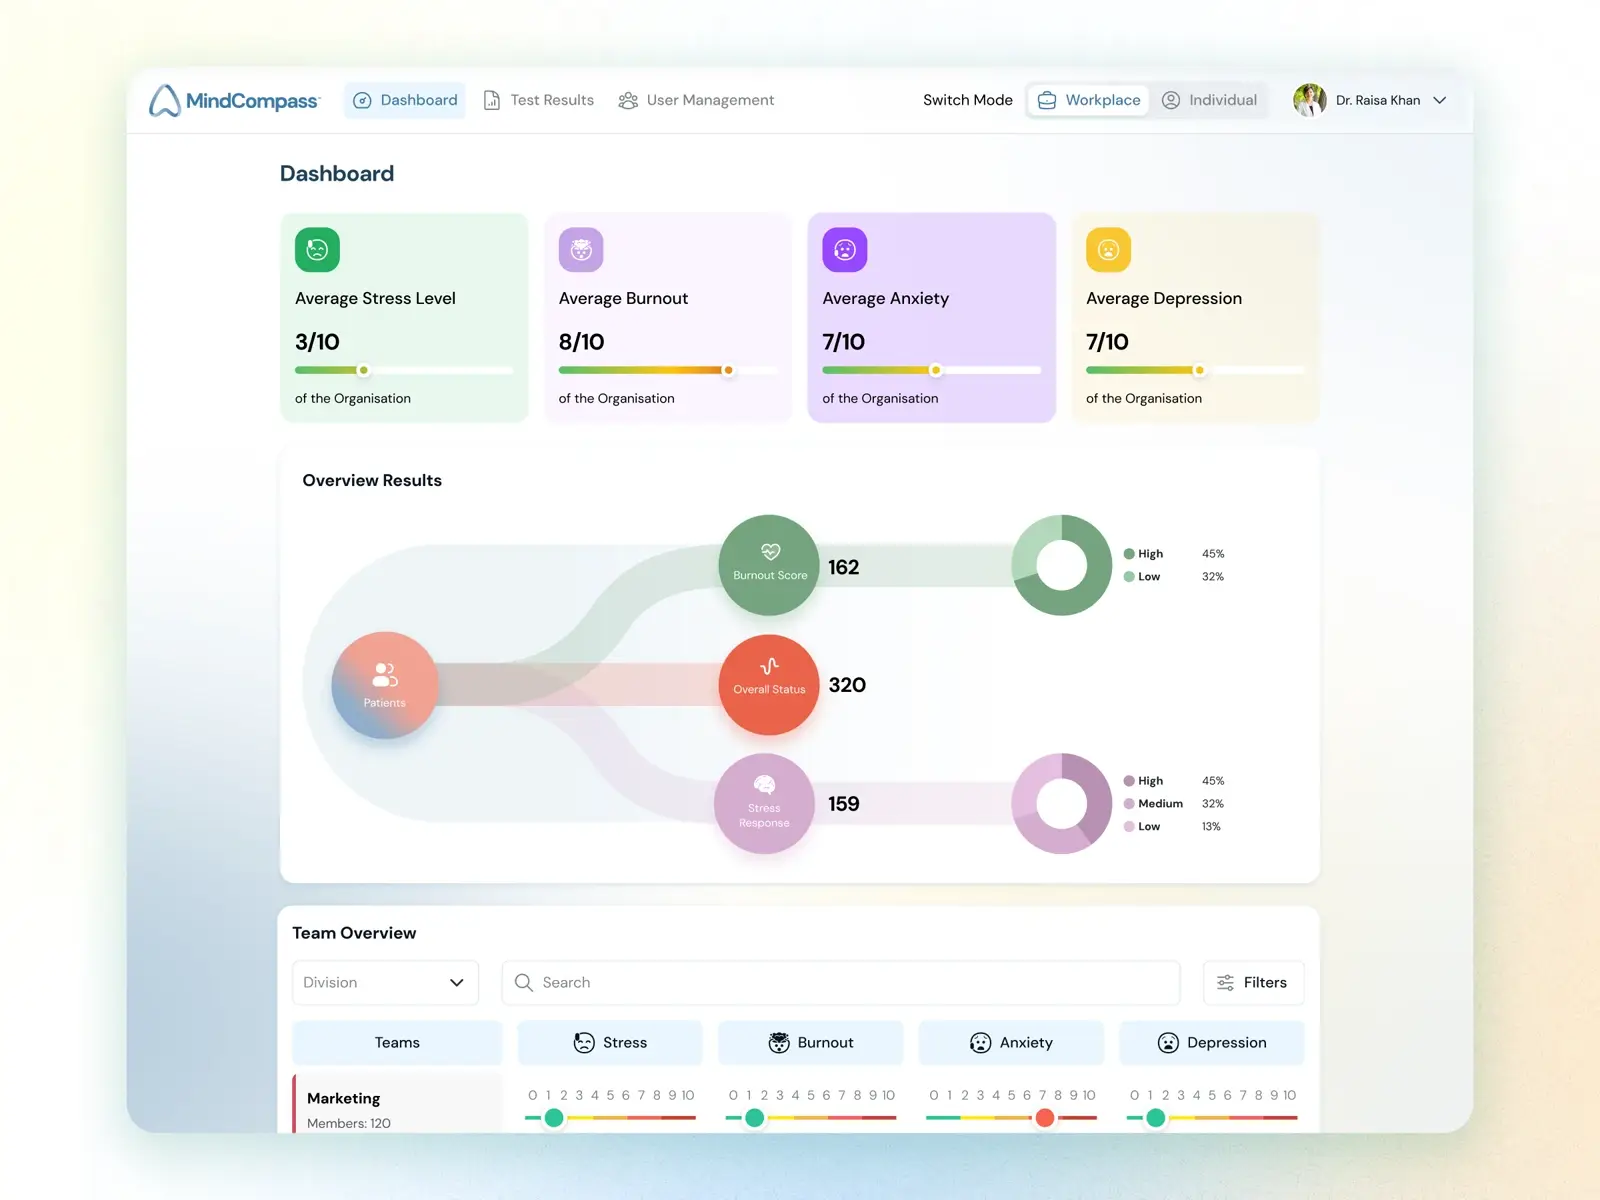
Averages for stress, burnout, anxiety and depression sit on a ten-point scale with the population they describe named right beneath them. A number with no denominator invites the wrong conclusion, so the denominator is never more than a line away.
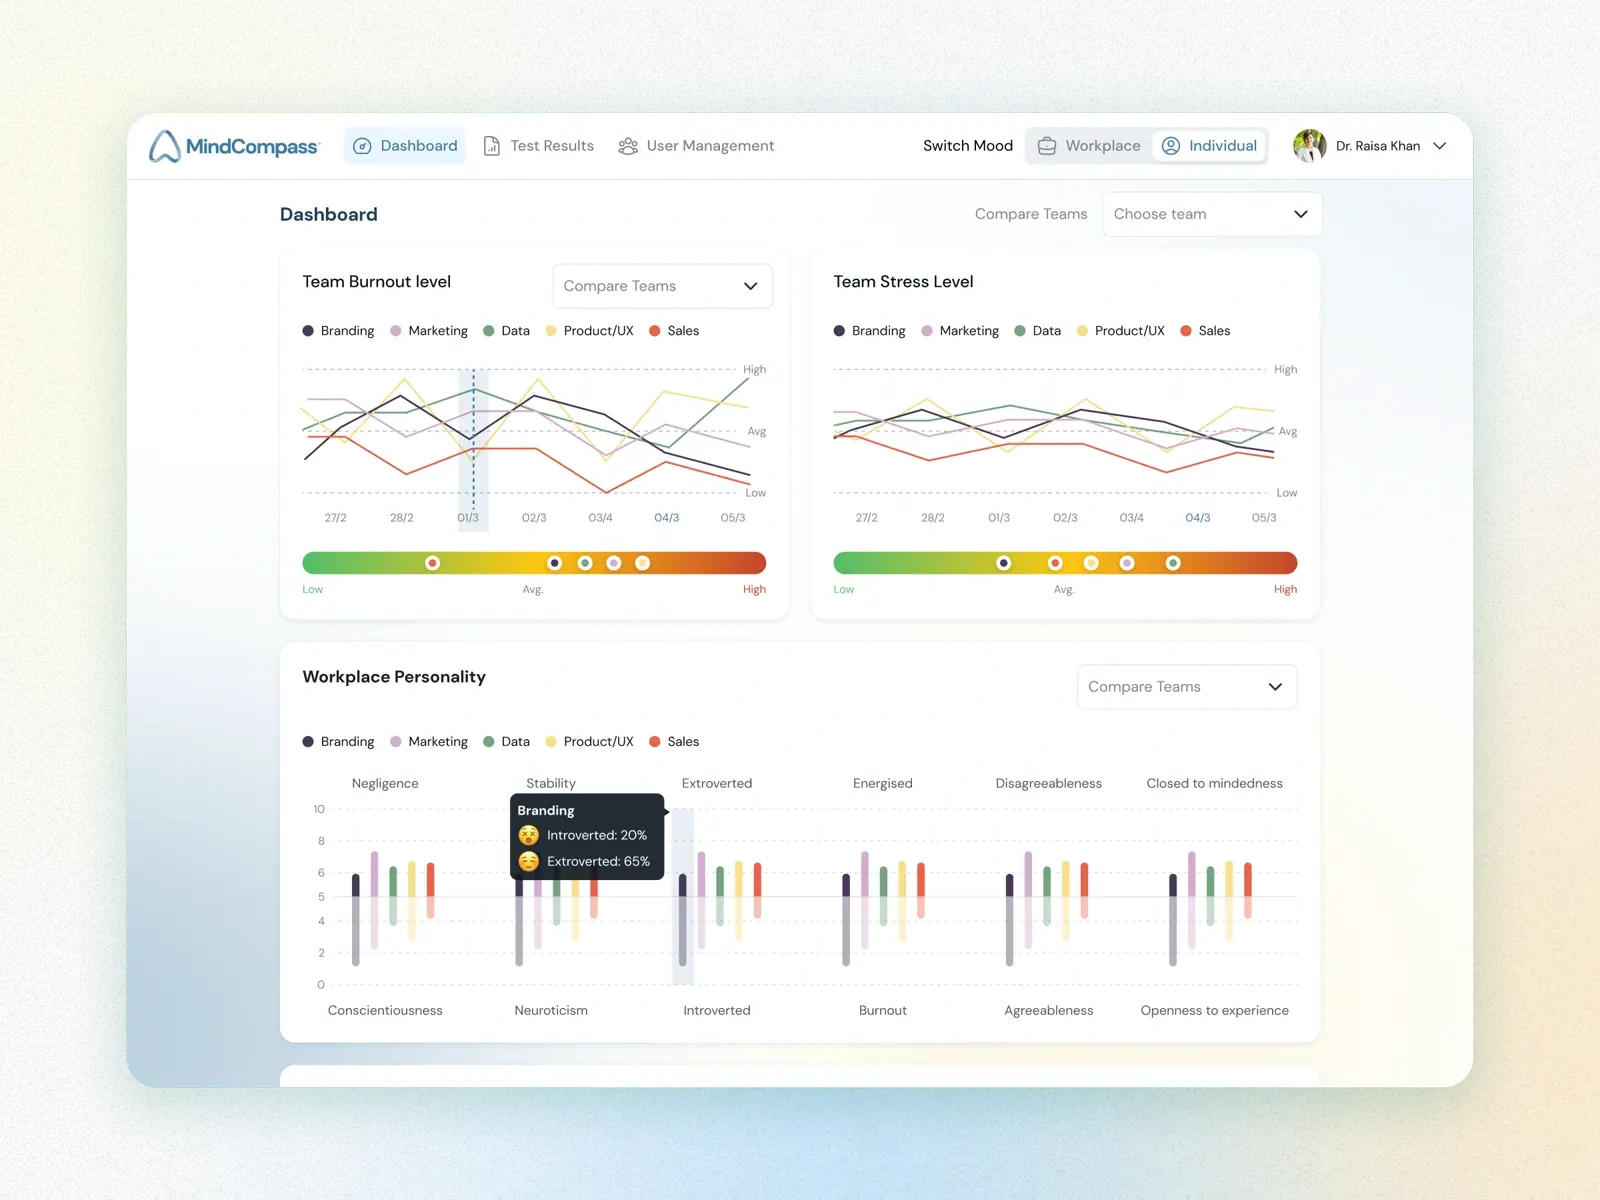
Teams compared without naming names.
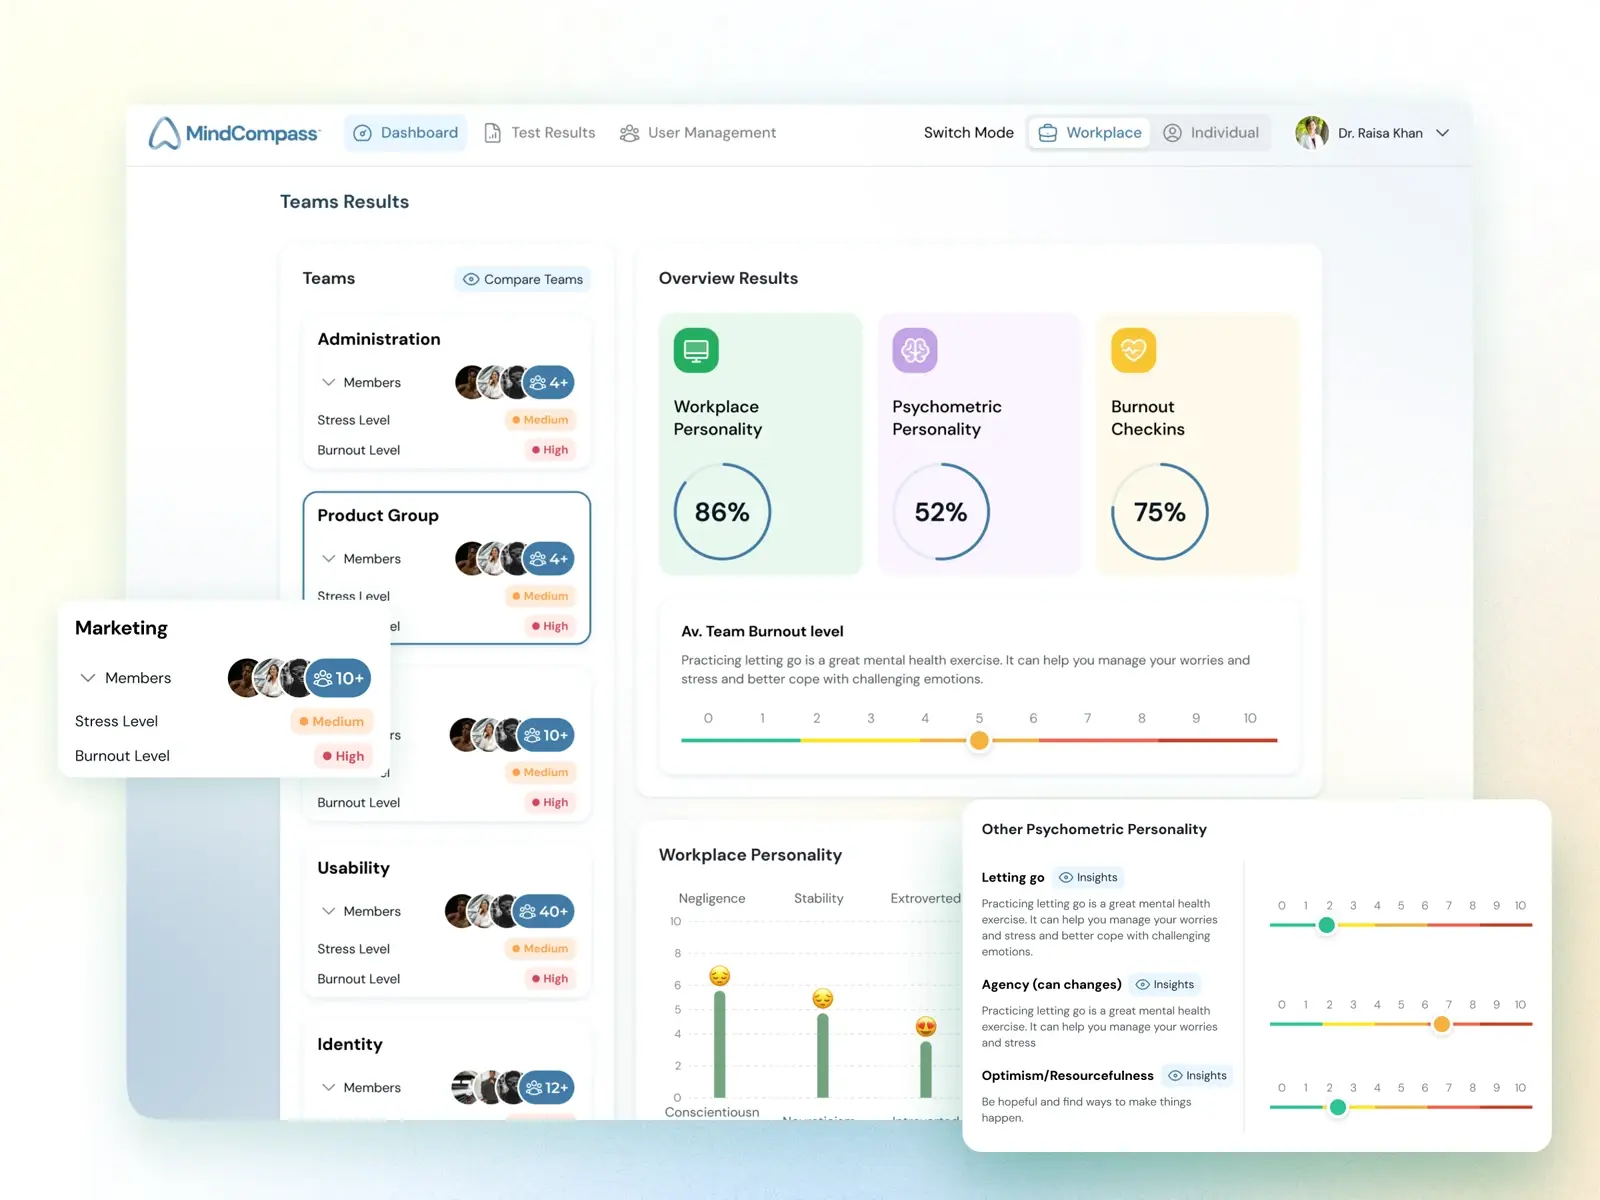
HR can hold departments side by side on burnout and stress over time, and read workplace personality across the group. It stops at the team line — individual results never surface in a comparison view, because a tool that lets a manager single someone out stops being answered honestly.
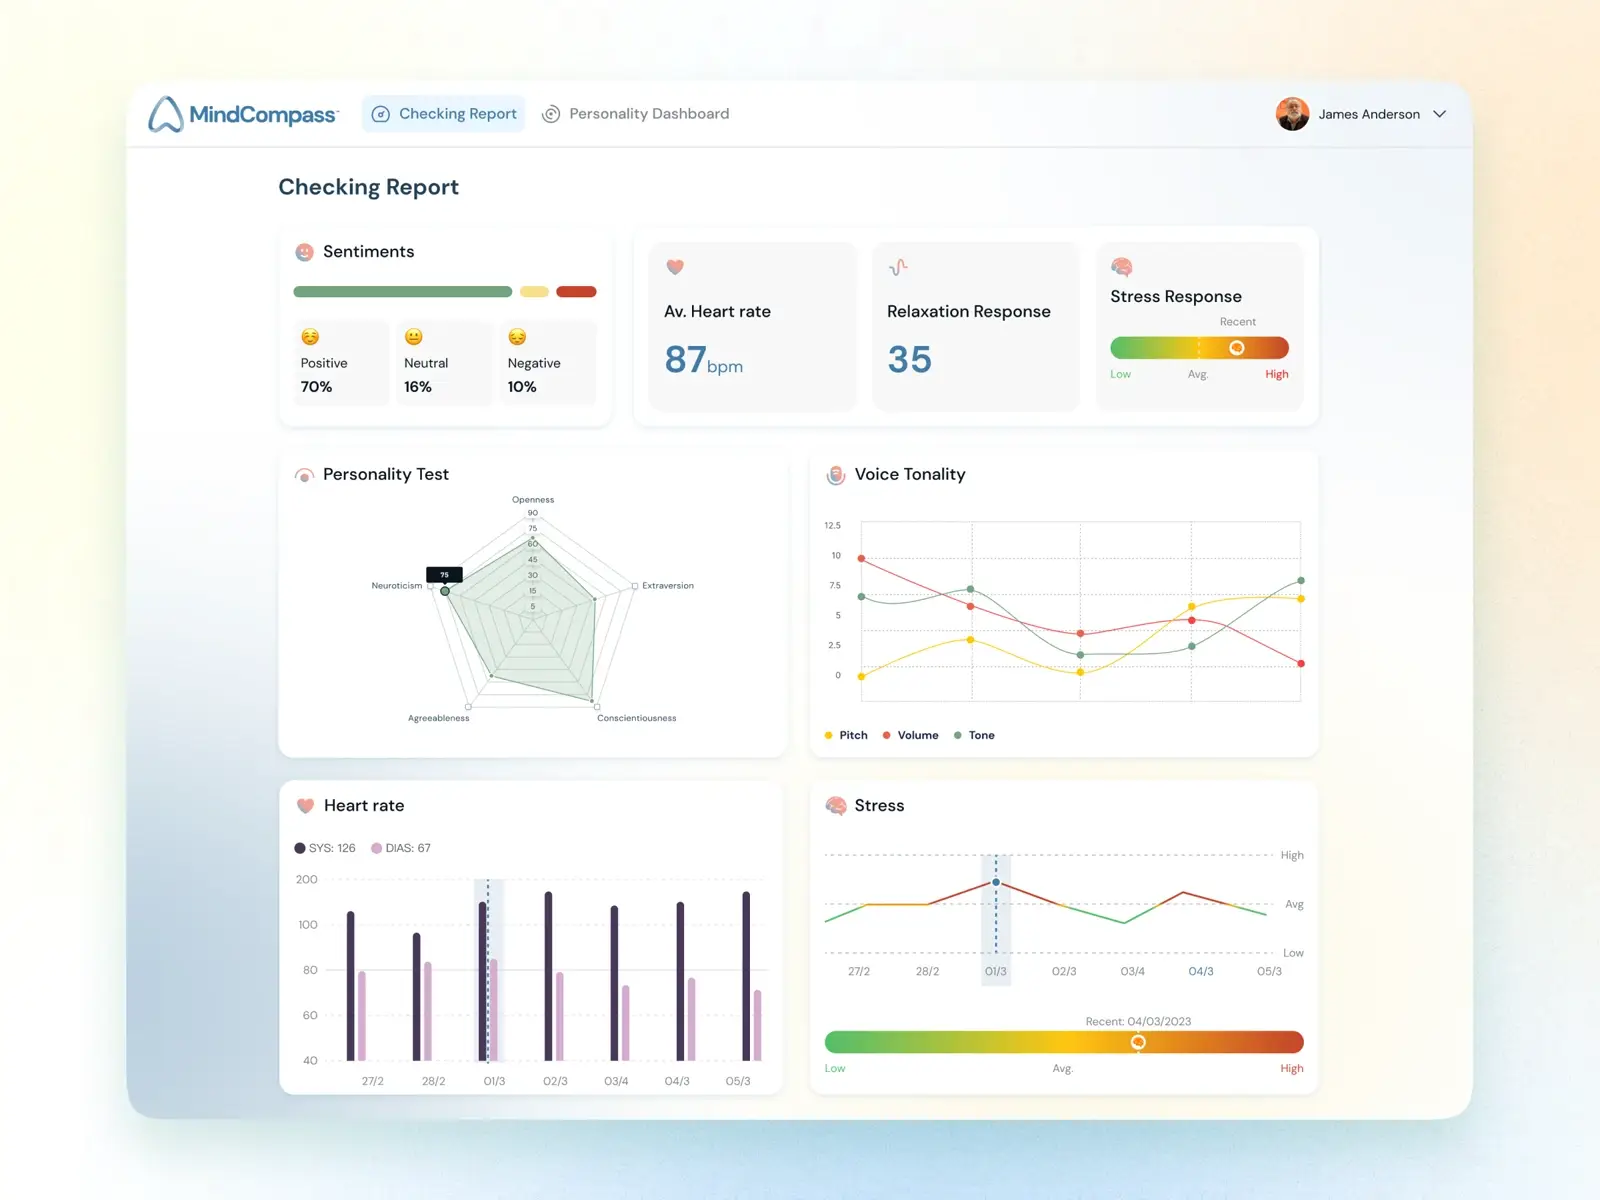
The individual report is the person's own.
Sentiment split, resting heart rate, relaxation and stress response, voice tonality over the session, and a personality profile — assembled into one report written for the person it describes rather than for the organisation paying for the licence.